From research question to the right metabolomics strategy
Explore how omics choice, metabolomics strategy and analytical quality shape the scientific value of your study—and why BEVITAL’s targeted approach is designed to deliver precise, reproducible data from precious samples.
Metabolomics is the systematic study of small-molecule metabolites (typically <1.5 kDa) and provides a functional readout of cellular physiology, reflecting perturbations that occur downstream of genomics, transcriptomics, and proteomics. It integrates many upstream and environmental effects, but is tissue-, time- and platform-specific and does not encode all upstream information.
Genomicswhat could happen
Proteomicswhat machinery is available
Metabolomicswhat is happening right now
Read the full definition
While genomics describes what could happen and proteomics describes what machinery is available, metabolomics provides a real-time snapshot of physiological and pathological states, describing what is happening right now in the biochemical network. Discordance between mRNA, protein, and metabolite levels is common due to translational control, enzyme kinetics, allosteric regulation, and substrate availability—factors that metabolomics captures directly.
In addition, metabolites are active regulators and not passive readouts, regulating genes, transcripts, and proteins by acting as signals and cofactors that influence transcription, RNA behavior, enzyme activity, post-translational modification, and protein stability. The upper figure shows an artistic visualization of the major omics layers, feedback loops and phenotype, annotated with the estimated number of molecular features for each omics. The Human Phenotype Ontology currently lists 18,000 phenotypic abnormalities.
When is metabolomics the right choice?4 scenarios
Choose metabolomics as the primary approach when the research question fits one of these four situations.
The phenotype is biochemical or functional
Suspected alterations in energy metabolism, redox state, one‑carbon metabolism, lipid signaling, or amino‑acid pathways in disease or treatment response.
Biomarker discovery where the readout should be close to physiology (e.g. acylcarnitines for mitochondrial function, bile acids for liver–gut axis, SCFAs for gut barrier/immune tone).
The exposure is environmental, dietary, pharmacological, or microbiome‑mediated
Nutritional interventions, fasting/feeding cycles, exercise challenges, or xenobiotic exposure where the internal dose and downstream biochemical effects matter.
Drug metabolism, off‑target effects, and host–drug–microbiome interactions (e.g. bacterial biotransformation of drugs, altered bile acid pools).
Need for an integrative, end‑point view
To see the net result of genetics, epigenetics, transcription, translation, post‑translational regulation, microbiome activity, and environment on the biochemical state in one layer.
For stratification and subtyping where symptomatically similar patients may have distinct metabolic endophenotypes despite overlapping genomic findings.
The key feature is rapid dynamics
Time‑course studies of acute stress, circadian variation, or challenge tests (OGTT, clamp studies, meal tests) where metabolite trajectories capture functional capacity and regulation.
Perturbation experiments in cell/animal models where flux and intermediate accumulation are central readouts.
Table 1: Comparison of omics layers
How the metabolome compares with the genome, transcriptome and proteome.
Omics Layer
Definition & Function
Time Scale of Change
Turnover Rate
Information Level
Genomics
The Blueprint: The complete set of DNA. Determines the organism’s potential and susceptibility.
Static: Largely unchanging throughout an individual’s lifetime (except for somatic mutations/cancer).
Stable
Potential: What can happen.
Epigenomics
The Switch: Chemical modifications (methylation, acetylation) to DNA/histones that turn genes on/off without changing the sequence.
Slow – Intermediate: Changes with age, lifestyle, and environmental exposure. Can act as a “cellular memory.”
Days to years
Regulation: How the blueprint is accessed.
Transcriptomics
The Message: The set of RNA transcripts (mRNA). Reflects which genes are currently active/expressed.
Fast: Responds to stimuli (drugs, stress) rapidly. Captures the intent to produce proteins.
Minutes to hours
Intent: What the cell is trying to do.
Proteomics
The Machinery: The set of expressed proteins. Executors of cellular function, signaling, and structure.
Intermediate: Slower than transcripts. Proteins are more stable and accumulate post-translationally.
Hours to days
Execution: The functional machinery present.
Metabolomics
The Result (Phenotype): Small molecules (<1.5 kDa) like sugars, lipids, amino acids. The end-product of all cellular processes.
Instantaneous: Highly dynamic. Levels fluctuate in seconds to minutes in response to diet, exercise, or drugs.
Seconds to minutes
State: What is actually happening right now.
Microbiomics
The Partner: The community of microorganisms (bacteria, viruses, fungi) living in/on the host (e.g., gut).
Mixed: Composition (DNA) is relatively stable (months/years), but Function (metabolic output) changes rapidly.
Hours to months
Ecosystem: The external functional capacity.
Multi-omics integrationincl. Table 2
In multi-omics designs, metabolomics frequently acts as the functional validation layer of upstream changes: a genetic variant or protein abundance shift may suggest pathway perturbation, and metabolite measurements show whether flux has actually changed.
Why combine metabolomics with other layers
It separates signal from noise
Thousands of genes may be turned on, but only a few might actually alter cell metabolism. Metabolomics helps identify which genetic changes are biologically relevant.
It captures the environment
Unlike the genome, which is static, the metabolome reacts to diet, drugs, and the microbiome. Combining them allows researchers to investigate how the environment modifies genetic programming.
It supports precision medicine
It helps move medicine from treating “risk factors” towards targeting the molecular dysfunction driving the disease.
Microbiome and metabolome
Integration of microbiome and metabolome data is emerging as a powerful approach to dissect host–microbe interactions in metabolic liver disease and other complex conditions. Microbiota-derived metabolites modulate host immunity, gene expression, and systemic metabolism, for example:
Short-chain fatty acids (SCFAs)
Produced by microbial fermentation of dietary fibers, SCFAs (acetate, propionate, butyrate) regulate gut barrier integrity, immune responses, and energy metabolism. Butyrate, in particular, inhibits histone deacetylases (HDACs), linking microbial metabolism to host epigenetic regulation.
Bile acids
Primary bile acids synthesized by the liver are converted to secondary bile acids by gut bacteria. These metabolites act as signaling molecules via nuclear receptors (e.g., FXR, TGR5), influencing lipid and glucose homeostasis, and inflammation.
Indoles and tryptophan metabolites
Microbial metabolism of tryptophan produces indoles, which activate host receptors (e.g., AhR, PXR), modulating gene expression, immunity, and gut barrier function.
Conversely, host-controlled metabolic outputs, particularly bile acid synthesis and immune signaling pathways, help shape microbial community composition and functional potential.
Table 2: Combination of metabolomics with other omics
Combination with
Primary Insight
Key Mechanism
Major Applications
Microbiomics
Distinguishes whether a blood marker comes from human cells or gut bacteria.
Crosstalk:Microbial metabolites (like SCFAs) act as signaling molecules that regulate human genes.
Gut–Brain axis (Alzheimer’s)
Liver disease (MASLD)
Diabetes
Proteomics
Validates function. High protein levels don’t always mean high activity; metabolites confirm the enzyme is working.
PTMs: Metabolites trigger “switches” (like phosphorylation) that turn proteins on/off.
Disease subtyping (e.g., Alzheimer’s)
Heart failure prediction
Functional biology
Epigenomics
Explains how environment/diet physically alters DNA regulation.
Cofactors: Epigenetic enzymes need fuel (metabolites like Acetyl-CoA) to modify DNA.
Cancer (oncometabolites)
Aging mechanisms
Dietary impact on genes
Genomics
Bridges the gap between genetic risk and actual disease.
Intermediate Phenotypes: Traces the path from Gene to Metabolite to Disease.
Untargeted, semi-targeted, and targeted metabolomics are three distinct strategies for studying metabolites. Selecting the most suitable approach depends on various factors, such as the research objectives and the study hypothesis.
Start from your research question
Discover → Untargetednew or unexpected metabolites, broad profiling, hypothesis generation
Focus → Semi-targeteda subset of metabolites from a defined pathway or class
Quantify → Targeteda predefined set of known metabolites, absolute values, hypothesis testing and validation
Untargeted
Untargeted metabolomics is a hypothesis-generating approach, analyzing as many metabolites as possible without prior knowledge of their identity. It is used for broad, comprehensive profiling and discovery of new or unexpected metabolites.
Semi-targeted
Semi-targeted metabolomics focuses on a subset of metabolites, often from a specific pathway or class, but without the strict quantification requirements of targeted approaches. It combines some level of metabolite selection with exploratory analysis.
Targeted
Targeted metabolomics specifically quantifies a predefined set of known metabolites. It is highly sensitive and precise, often used for hypothesis-driven research or validation of known metabolic pathways.
Targeted, semi-targeted and untargeted compared50–200 vs 10,000+
Targeted approaches are typically used for hypothesis testing, whereas untargeted methods are employed to generate hypotheses and discover new or unknown metabolites (Table 1).
50–200metabolites in a typical targeted assay
10,000+features in a typical untargeted run
Targeted metabolomics covers a limited range of analytes; untargeted approaches provide broader data.
When it comes to quantitative data quality, targeted approaches generally offer advantages over untargeted methods:
Comparability
Untargeted metabolomics provides relative quantification, limiting the ability to compare data across different experiments, labs, cohorts, or studies.
Clinical readiness
Targeted metabolomics delivers absolute quantification (typically in nmol/L or µg/mL), which is essential for clinical diagnostics and especially valuable when validation and regulatory approval are required.
Standardization
Untargeted methods are less standardized, which can lower assay reproducibility and lead to inconsistent findings across studies.
Specificity and sensitivity
Targeted approaches typically offer higher specificity and sensitivity, as they are optimized for a defined set of well-characterized analytes.
Automation
Automation is more feasible in targeted workflows, with analytes measured under well-established parameters.
Data interpretation
Data interpretation is faster and more cost-effective with targeted approaches, while untargeted methods typically require more extensive statistical analysis.
Where semi-targeted fits
Semi-targeted metabolomics is a middle ground, suitable when researchers need both breadth and specificity, typically around defined biochemical pathways. It does not fully replicate the discovery power of untargeted or the precision of targeted metabolomics, but it is a versatile approach for studies with a defined focus.
Low: Primarily focuses on validating or quantifying pre-defined metabolites. It is not designed to discover novel or unexpected compounds.
High: The primary strength of untargeted metabolomics. Aims to detect and identify a broad range of metabolites, including novel, unknown, or unexpected compounds, leading to new hypotheses and biomarker identification.
Coverage
Limited, focused: Measures a predefined, relatively small set (tens to a few hundreds) of known metabolites.
Broad, comprehensive: Aims to detect and identify as many metabolites as possible (hundreds to thousands), including novel or unknown compounds.
Quantification
Absolute Quantification: Typically uses stable isotope-labeled internal standards and calibration curves for precise and accurate quantification of specific metabolites.
Relative Quantification: Provides relative changes in metabolite levels between samples (e.g., fold changes). Absolute quantification is challenging due to the lack of standards for all detected compounds.
Standardization
High: Methods are highly standardized, with established protocols for sample preparation, instrument parameters, and data processing. Relies on validated analytical methods for specific analytes.
Lower: Due to the discovery-driven nature and broad scope, standardization is more challenging. Variations in sample preparation, analytical platforms, and data processing workflows can impact results.
Reproducibility
High: Excellent reproducibility due to well-defined analytical parameters, use of internal standards, and focus on a limited set of analytes.
Moderate to Good: Can be challenging due to the complexity of the data, potential for noise, and variability in metabolite identification. Robust quality control (QC) practices are crucial to improve reproducibility.
Specificity
High: Designed to specifically detect and quantify a particular metabolite, minimizing interference from other compounds. Uses specific precursor-product ion transitions.
Lower (for individual metabolites): While sensitive to many compounds, the high number of detected features can make precise identification and confirmation of individual metabolites challenging, especially for unknown compounds.
Sensitivity
High: Optimized for the sensitive detection of the targeted metabolites, often achieving low limits of detection (LODs) for specific compounds.
Variable: Overall sensitivity is good for detecting a wide range of compounds, but for any single metabolite, it might be lower than a highly optimized targeted assay for that specific compound.
Automation
High: Highly amenable to automation, from sample preparation to data acquisition and initial processing, due to defined workflows.
Moderate: While data acquisition can be automated, significant manual intervention is often required for data processing, peak annotation, and metabolite identification due to the complexity and sheer volume of data.
Data Interpretation
Straightforward: Data is typically presented as absolute or relative concentrations of known metabolites, making interpretation and pathway mapping relatively direct and hypothesis-driven.
Complex: Generates large, complex datasets requiring sophisticated bioinformatics tools, multivariate statistical analysis, and often manual curation for metabolite identification. Interpretation is more discovery-driven and can lead to new hypotheses.
FDA Approval
More Feasible (for specific assays): While there aren’t many broadly “FDA-approved metabolomics tests” as a whole, individual targeted metabolomics assays can and are being developed and validated for specific diagnostic purposes (e.g., inborn errors of metabolism screening). They b…
Highly Challenging (for broad application): Direct FDA approval for a general “untargeted metabolomics test” is currently very difficult, if not impossible, due to the inherent complexity, lack of comprehensive standardization across all detectable metabolites, and the discovery-ori…
Dynamic range: exploring the deep seapmol/L to mmol/L
Over the last 20 years, BEVITAL’s scientists and technicians have specialized in targeted metabolomics, and our panels have been applied in many hypothesis-driven projects and biomarker validation studies.
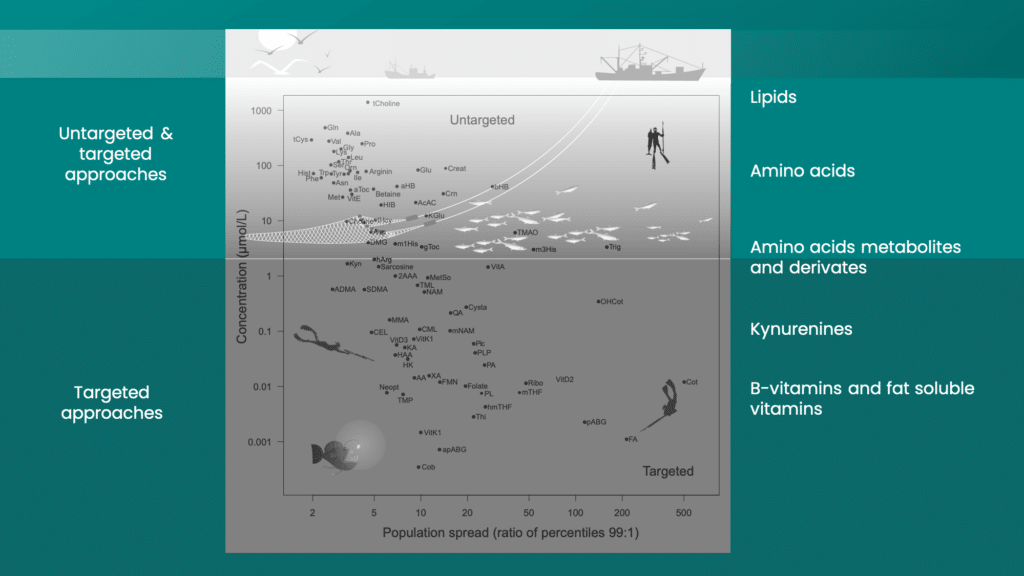
BEVITAL’s diverse analytical platforms are designed to be both analytically and biologically complementary, established across dedicated GC- and LC-MS/MS systems. As a result, our metabolomic platforms enable quantification of a wide range of related metabolite classes, spanning both low- and high-abundance compounds within physiologically relevant dynamic ranges from pmol/L to mmol/L. Unlike untargeted approaches, which often produce missing data for low-abundance metabolites while “fishing on the surface of the ocean” (Fig. 1), targeted methods allow researchers to “explore the deep sea” and quantify metabolites within their physiological concentration range.
pmol/L → mmol/Lphysiological range quantified by targeted methods
Missing datacommon for low-abundance metabolites in untargeted profiling
Fig. 1: Dynamic range. Exploring the “Deep Sea of Metabolomics” by targeted metabolomics. Various metabolites and biomarkers are plotted against their physiological concentrations and spread in the general population. Click the figure to enlarge.
Targeted methods quantify metabolites across their physiological concentration range, including low-abundance metabolites that untargeted profiling often misses.
Explore the scientific comparison3–7× lower CVs
Isotope-labeled internal standards (ILIS) are considered the gold standard for quantification in metabolomics.
However, because authentic ILIS (AILIS) are either unavailable or very expensive for certain metabolites, most targeted approaches and metabolomics labs use non-authentic ILIS for many of their analytes. In contrast, BEVITAL’s methods rely on authentic ILIS for each analyte, enabling relative and absolute metabolite quantification with high precision, consistently validated through participation in external quality programs (see Why analytical quality matters).
AILIS offer higher precision with 3–7 times lower CVs (Ulvik et al.), which is crucial in small cohort studies that often have limited statistical power to detect true biological differences. Additionally, internal data from our group indicate that quantification using non-authentic ILIS can lead to false-positive results. These artifacts, known as spurious correlations since Pearson described them in 1897, are best avoided through targeted approaches specifically designed to quantify each analyte using its AILIS.
In metabolomics, analytical data quality reflects how reliably metabolite concentrations can be measured and interpreted. High-quality data are characterized by both accuracy (results closely reflect true metabolite levels) and trustworthiness (results are consistent and reproducible across different experiments and laboratories). This reliability hinges on achieving high precision and strong reproducibility.
In many metabolomics research scenarios, data quality can be more important than the sheer quantity of data points or samples. While large sample sizes are generally desirable for statistical power, if the underlying data are noisy, inaccurate, or irreproducible, even a massive dataset can lead to misleading or biased conclusions.
“Bigger isn’t always better. The quality of your data often matters as much as — and sometimes more than — the sheer quantity.” — Rishabh Iyer
Explore the quality evidence
Table 1: Research scenarios requiring high data quality8 scenarios
Discovery and mechanism
Biomarker discovery & validation for diagnostics/prognostics
High precision, accuracy, and reproducibility are critical for identifying reliable biomarkers. Low quality leads to false positives or missed true biomarkers, hindering clinical utility and regulatory approval.
Mechanism of action studies
Accurate and specific quantification of pathway intermediates and end products is essential to correctly map metabolic perturbations to specific biochemical pathways and understand underlying biological processes.
Quantitative pathway modeling & flux analysis
These advanced computational analyses rely on highly accurate and precise quantification of metabolites to build reliable mathematical models and determine metabolic fluxes. Inaccurate input data generates fundamentally flawed models.
Drug development and the clinic
Pharmacometabolomics & drug efficacy/toxicity studies
Even subtle metabolic changes can indicate drug effects. Inaccurate or noisy data can obscure true drug mechanisms, efficacy, or adverse events, leading to flawed drug development decisions.
Clinical trials (later phases: II/III)
Data quality, reproducibility, and standardization are paramount for regulatory scrutiny and informing critical decisions about drug development, patient stratification, and treatment monitoring. Results directly impact patient care.
Translational research (bench to bedside)
Reliable translation of findings from basic research (e.g., animal models, cell lines) to human clinical applications requires robust and consistent data. Poor quality or irreproducible data at any stage can invalidate promising preclinical discoveries upon clinical testing.
Demanding study designs
Studies with limited, precious samples
When samples are scarce (e.g., rare diseases, specific tissues), maximizing high-quality data from each individual sample is crucial. Poor quality would waste invaluable biological material and lead to insufficient insights.
Multi-center studies
Consistency and comparability across sites are critical. Low data quality (e.g., high technical variability, different instrument performance, inconsistent protocols) across different laboratories will introduce significant batch effects and confound real biological variations, making results incomparable and invalidating conclusions despite large sample numbers.
Ensuring data quality in metabolomics workflows3 stages
Data quality in metabolomics is a multifaceted concept, defined by meticulous attention to detail across the entire research workflow.
01 · Pre-analytical
Initial sampling, processing and storage, where sample degradation, contamination and heterogeneity during collection can undermine the quality of the downstream analytical data. Sample handling and stability →
02 · Analytical
The choice of the analytical method, the use of internal standards, and accurate peak detection and integration.
03 · Post-analytical
Data scaling and normalization that adjust for the relative ranges and variance of each metabolite across all samples and mitigate batch effects.
Ultimately, all of these factors (pre-analytical, analytical and post-analytical) determine whether the generated data reflect biological differences rather than technical artifacts, which is vital for ensuring equal statistical weight in downstream statistical analyses.
Targeted metabolomics is an analytical approach focused on the precise measurement and quantification of a defined set of known metabolites. Unlike untargeted metabolomics—which surveys as many metabolites as possible—targeted metabolomics deliberately concentrates on specific compounds. This approach is fundamental to the quality of data generated by targeted metabolomics, providing:
Accurate and precise absolute quantitation
Reliable detection of specific metabolites
Sensitive and reproducible measurements
Robust application for clinical and research purposes
For the last two decades, BEVITAL’s targeted metabolomics methods have been developed by scientists and engineers who required uncompromising quality for their own research projects. BEVITAL’s staff therefore has long experience in handling pre-analytical factors such as sample degradation or assay interference. BEVITAL’s analytical methods are publicly available, and key data on assay precision, accuracy and sensitivity can be found in the methods section.
Analytical quality and statistical power
Power calculation is a critical statistical tool used to determine the necessary sample size for a study to detect a meaningful effect if one exists.
However, its application in epidemiological and clinical studies is often problematic. Many researchers neglect to perform power calculations due to a lack of awareness or the inability to estimate the required parameters.
Furthermore, a major critique from experts is that power calculations are fundamentally flawed when the effect size is unknown, as is often the case in discovery-based clinical research. This can lead to inaccurate power estimates and an inappropriate sample size.
The challenges associated with statistical power underscore the importance of high analytical quality data which minimizes measurement variability and increases confidence in results, reducing the risk of biased or misleading conclusions.
Gain in precision with authentic isotope-labeled internal standards2.7–5.9% CV
BEVITAL’s analytical platforms, which use authentic isotope-labeled internal standards (AILIS) for each analyte, typically achieve higher assay precision than semi-targeted or untargeted methods.
2.7–5.9%median between-run CV with AILIS
up to +10.7 pphigher median CV with non-authentic standards
Our internal standards (IS) yield median between-run coefficients of variation (CVs) as low as 2.7–5.9%. In contrast, non-authentic standards can result in median CVs up to 10.7 percentage points higher.
For individual platforms and analytes (A), the decrease in precision can be quite dramatic as illustrated in Figure 1 showing the assay CVs for several fat-soluble vitamins (Vit. D3, Vit. A, Vit. D2, γ-toc., α-toc., Vit. K1; authentic (x=y), non-authentic (x≠y)).
Figure 1
Fig. 1: Precision by different internal standards.
With an authentic isotope-labeled internal standard for each analyte, assay CVs stay low; with non-authentic standards they can rise sharply.
Effect of precision on statistical power57 vs 226 subjects
By improving precision, we can boost statistical power, which enables our customers to detect significant changes with either smaller effect sizes or in smaller sample sizes, making studies more feasible and cost-effective.
As demonstrated in Figure 2, the required sample size (N) for a study is heavily dependent on the assay’s precision, represented by the coefficient of variation (CV). The calculations are based on two-sample tests with a type I error (α) of 0.05 and a power of 0.90.
57subjects per group at CV 5%
226at CV 10%
905at CV 20%
2037at CV 30%
Subjects per group needed to detect a 3% change (x: ratio of means).
As a rule of thumb, a twofold decrease in assay precision necessitates a quadrupling of the study group size to maintain statistical power.
Figure 2
Fig. 2: Study size (N) as function of effect size (% change) for different CVs.
The required study size grows steeply as the assay CV rises, so better precision means fewer samples per group.
Spurious correlation with non-authentic isotope-labeled internal standardsρ −0.05 vs 0.48
Another critical advantage of AILIS is its ability to reduce spurious correlations between biologically unrelated analytes.
When a single internal standard is shared among multiple analytes, its inherent variability can create a false correlation, increasing the risk of false-positive findings. This phenomenon, described by early statisticians like Pearson, Galton, and Weldon, is still often overlooked.
ρ −0.05valine vs serine with AILIS
ρ 0.48with a non-authentic standard
Spearman correlation between signal ratios A/IS (Figure 3).
In Figure 3, the Spearman correlation (ρ) between signal ratios A/IS of valine and serine is low (ρ=−0.05) when using AILIS (green dots), correctly reflecting their biological independence. However, using a non-authentic standard inflates the correlation to ρ=0.48 (red dots), demonstrating how non-authentic standards can create misleading relationships in the data.
Furthermore, inadequate signal ratios of analyte to internal standard can directly compromise analytical quality. When the analyte signal is much lower than the internal standard, or vice versa, the method’s accuracy, precision, and sensitivity are at risk due to suppression, contamination, or mismatched behavior.
As illustrated in the inset of Figure 3, the AILIS approach (green dots) yields a tightly grouped set of ratios centered on 1.0. In contrast, the use of various non-authentic standards (represented by purple, yellow, red, and blue dots) results in ratio distributions that deviate from this center (on a logarithmic scale). The calculated Spearman correlation coefficients for these distinct clusters further demonstrate that employing non-authentic standards leads to increased spurious correlations.
Figure 3
Fig. 3: Correlation between signal ratios A/IS for amino acids valine and serine using different internal standards.
A shared, non-authentic internal standard can create correlations between analytes that are not biological.
Conclusion
BEVITAL’s targeted analytical approach, using AILIS, is designed for high precision, reliability and reproducibility, enhancing statistical power and reducing the risk of false or misleading findings. This makes our platforms a powerful and trustworthy tool for basic, clinical and epidemiological research.
The right omics layer, the right strategy and reliable data quality all shape the scientific value of a study. BEVITAL brings these together in one targeted metabolomics service, built on six strengths.
High-precision targeted metabolomics
Analyte-specific authentic isotope-labeled internal standards support precise absolute quantification and statistical power.
Physiologically relevant measurement ranges
Methods cover diverse concentration ranges and matrices, helping limit missing data.
Reliable quantification and QC
Rigorous internal controls and participation in external quality-assessment programs support accuracy and reproducibility.
Complementary pathway coverage
Panels combine related analytes, markers, metabolites, vitamins and cofactors, and can be customized to your study.
Scientific support
Assistance may extend from study planning and funding applications to analysis, interpretation and manuscript review.
20+ years of experience
Extensive experience in bioanalytical technology development, sample handling and large epidemiological studies.
Planning a study? Tell us about your samples and research question, and we will help you find the right panels.